Checklist SQL Server
SQL Server Performance Tuning Checklist
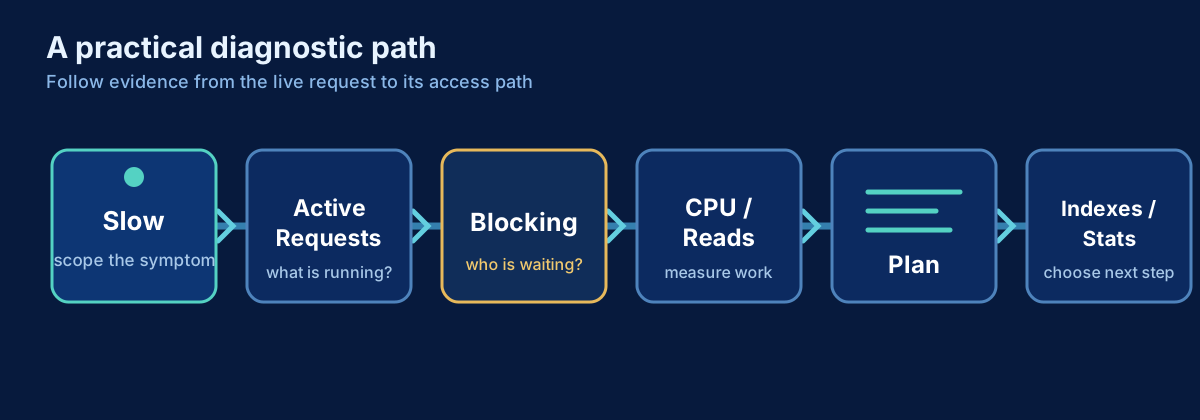
A one-page troubleshooting reference for slow SQL Server workloads: ten steps from incident scope to measured change, with three diagnostic queries.
- Type
- Checklist
- Level
- Intermediate
- Format
- Printable
In short
Narrow the symptom before changing anything: scope, active work, blocking, expensive queries, plans, statistics and indexes, history, large modifications, then one measured change. The full article explains the reasoning behind each step.
Who it is for
- DBAs and data engineers on call for a slow SQL Server workload
- Developers asked to explain why a query regressed
What it helps you do
- Move from "the database is slow" to a specific, reproducible statement
- Collect evidence before changing anything
- Make one change at a time and prove it helped
Work top to bottom. Each step narrows the problem before the next one, and nothing is changed until step 10.
1. Confirm the incident scope
- Record the time window, including time zone.
- Name the affected database, application, login and host.
- Decide whether everything is slow or one operation is slow, and whether it is still happening.
- Preserve evidence before restarts or cache clears: Query Store, active requests, waits, monitoring graphs.
2. Check active requests
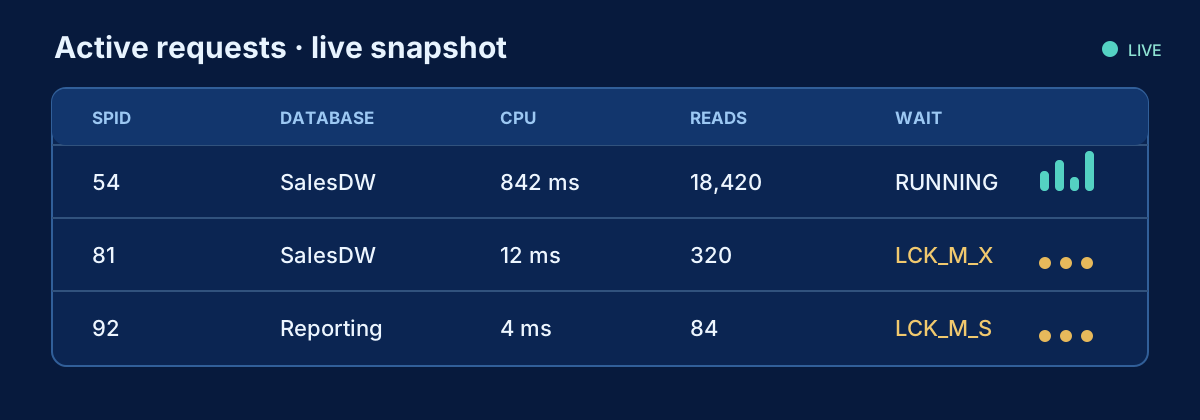
- List what is running now, with CPU, reads, writes, elapsed time and wait type (query A below).
- Take several samples; one snapshot can mislead.
- Long elapsed time with little CPU usually means waiting, not working.
3. Identify blocking
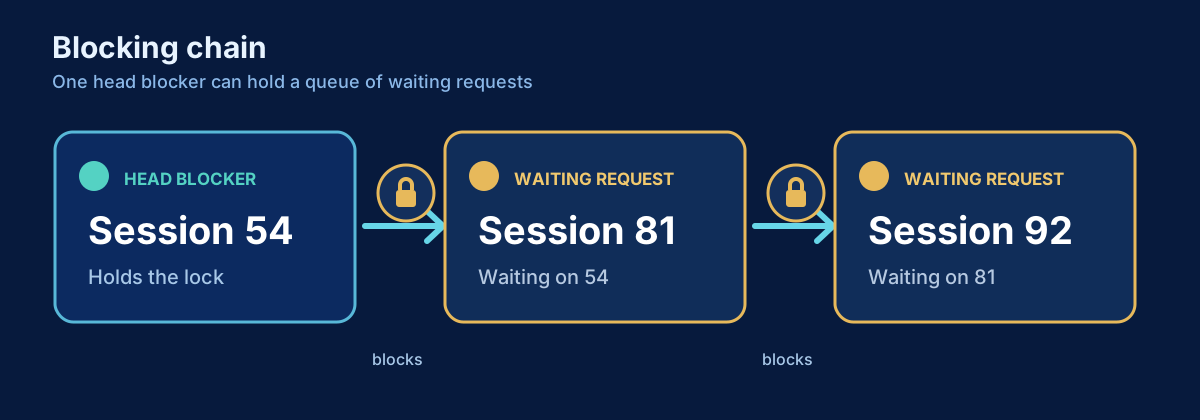
- Find blocked requests and the head blocker (query B below).
- Check the head blocker’s open transactions, last statement and application.
- Do not kill the blocker by default: understand the rollback cost and agree with the application owner first.
4. Find expensive queries
- Rank by CPU, logical reads, writes, duration and execution count.
- Group active work by login, database and host to see who creates the pressure (query C below).
- A cheap query run thousands of times can cost more than one slow query.
5. Review execution plans
- Use the actual plan together with runtime metrics.
- Look for spills, large key lookup counts, unexpected scans or joins, and excessive parallelism.
- Compare rows read with rows returned. Operator cost percentages are estimates, not measurements.
6. Check estimates and statistics
- Compare estimated and actual rows at the key operators.
- Check when the relevant statistics were last updated and how much the data changed since.
- Update statistics deliberately, on the objects involved, and measure the result.
7. Review indexes
- Review existing indexes before adding one: overlaps, duplicates, unused indexes.
- Treat missing-index suggestions as clues, not instructions.
- For a new index, record the target query, baseline reads, write cost and rollback.
8. Check Query Store
- Did the query get a new plan, run more often, or slow down on the same plan?
- Compare runtime distributions across time windows, not single executions.
- If you force a plan as a mitigation, record why and when it will be reviewed.
9. Review large modification operations
- Look for large
UPDATE,DELETEorINSERTstatements holding locks and growing the log. - Batch them, with an indexed predicate, restartable logic and a measured batch size.
10. Measure before and after changes
- Record a baseline: duration, CPU, reads, waits and the plan.
- Change one understood variable, with a rollback path.
- Measure again under comparable load and keep the before/after numbers with the change.
Quick SQL
Reading these DMVs requires VIEW SERVER STATE (or VIEW SERVER PERFORMANCE STATE on newer
versions). Query text can contain sensitive values: do not paste it into unsecured tickets or chat.
A. Active requests
SELECT r.session_id, s.login_name, s.host_name,
       DB_NAME(r.database_id) AS database_name,
       r.status, r.command, r.blocking_session_id,
       r.cpu_time, r.total_elapsed_time, r.logical_reads, r.writes,
       r.wait_type, r.wait_time,
       txt.text AS batch_text
FROM sys.dm_exec_requests AS r
JOIN sys.dm_exec_sessions AS s ON s.session_id = r.session_id
CROSS APPLY sys.dm_exec_sql_text(r.sql_handle) AS txt
WHERE s.is_user_process = 1
  AND r.session_id <> @@SPID
ORDER BY r.total_elapsed_time DESC;
B. Blocking: blocked requests and head blockers
-- Who is waiting, and on whom
SELECT r.session_id, r.blocking_session_id, r.wait_type, r.wait_time, r.wait_resource,
       DB_NAME(r.database_id) AS database_name, s.login_name, s.host_name
FROM sys.dm_exec_requests AS r
JOIN sys.dm_exec_sessions AS s ON s.session_id = r.session_id
WHERE r.blocking_session_id <> 0
ORDER BY r.wait_time DESC;

-- Head blockers: block others but are not blocked themselves (may be sleeping with an open transaction)
SELECT s.session_id, s.login_name, s.host_name, s.status, s.open_transaction_count,
       s.last_request_end_time, txt.text AS most_recent_statement
FROM sys.dm_exec_sessions AS s
JOIN sys.dm_exec_connections AS c ON c.session_id = s.session_id
LEFT JOIN sys.dm_exec_requests AS r ON r.session_id = s.session_id
OUTER APPLY sys.dm_exec_sql_text(c.most_recent_sql_handle) AS txt
WHERE s.session_id IN (SELECT blocking_session_id FROM sys.dm_exec_requests WHERE blocking_session_id <> 0)
  AND ISNULL(r.blocking_session_id, 0) = 0;
C. Workload grouped by login, database and host
SELECT s.login_name, DB_NAME(r.database_id) AS database_name, s.host_name,
       COUNT(*) AS active_requests,
       SUM(r.cpu_time) AS cpu_time_ms,
       SUM(r.logical_reads) AS logical_reads,
       SUM(r.writes) AS writes
FROM sys.dm_exec_requests AS r
JOIN sys.dm_exec_sessions AS s ON s.session_id = r.session_id
WHERE s.is_user_process = 1
GROUP BY s.login_name, DB_NAME(r.database_id), s.host_name
ORDER BY logical_reads DESC;
These totals cover requests active at that instant only. Use Query Store or monitoring for a longer window.
Go deeper: related articles
SQL Server
SQL Server Is Slow: A Practical Troubleshooting Workflow
A production-first workflow for turning a vague SQL Server slowdown into evidence, a likely cause, and a safe next step.
SQL Server
How to Find What Is Running in SQL Server Right Now
A production-safe DMV query for active SQL Server requests, including statement text, identity, resource use, waits and blocking.
SQL Server
How to Get a SQL Server Session ID and See What It Is Doing
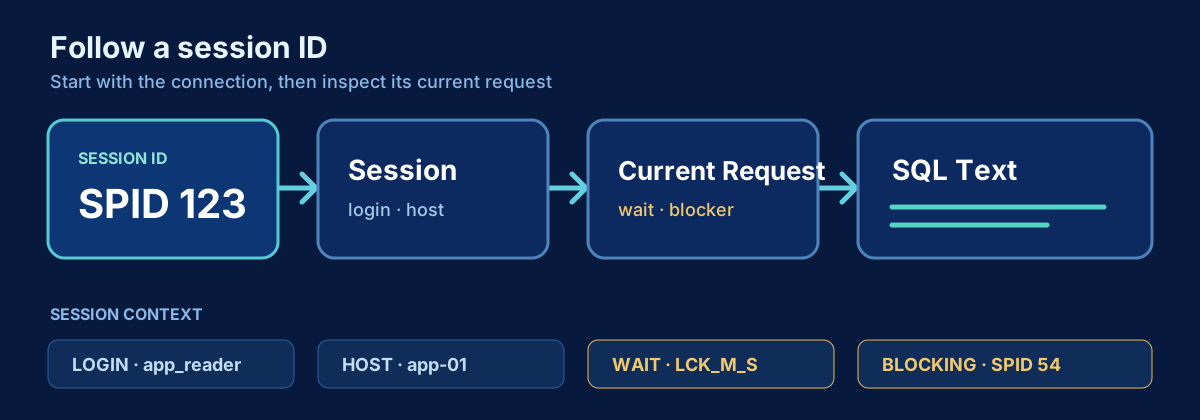
Find your SQL Server session ID, investigate another session, and inspect its request, SQL text, waits, blocking and open transaction state.
SQL Server
How to Find Blocking in SQL Server
Find blocked requests, trace blocking chains to the head blocker, and inspect the responsible session and transaction safely.
Planned articles on these topics
- PlannedSQL Server Troubleshooting Queries: Quick Reference
- PlannedHow to Investigate Very Large SQL Server Tables
- PlannedHow to Troubleshoot a Large UPDATE in SQL Server
- PlannedParameter Sniffing in SQL Server: Diagnose It Before You Fix It
- PlannedSQL Server Statistics: Why Good Indexes Can Still Produce Bad Plans