SQL Server
SQL Performance Analyzer
A practical SQL Server and Python tool for investigating workload: active sessions, blocking, waits and expensive queries, grouped so the real problem stands out.
- Status
- Planned
- Level
- Intermediate
Planned project: this page describes the intended design. No code, repository or demo has been published yet.
Project overview
Who this is for
- Students learning how SQL Server exposes what it is doing, through DMVs and Query Store
- DBAs and engineers who need a repeatable first response to "the database is slow"
- Teams that want consistent incident evidence instead of ad-hoc screenshots
What you will learn
- Which dynamic management views answer which performance question
- How to read active requests, waits, blocking chains and resource usage
- How to find the queries with the most total impact, not just the slowest one
- How to group workload by database, login, host and application
- How to collect evidence safely, with read-only permissions and low overhead
- How to connect Python to SQL Server and turn result sets into a report
Tech stack
- SQL Server
- T-SQL
- Dynamic Management Views
- Query Store
- Python
- GitHub
On this page
The problem
When someone reports that SQL Server is slow, the first minutes decide whether the investigation is evidence-based or guesswork. The information is all there, in dynamic management views (DMVs) and Query Store. But collecting it by hand is slow, inconsistent between engineers, and easy to get wrong under pressure. Evidence disappears too: a restart or a killed session removes the state that explained the problem.
The SQL Performance Analyzer is designed to make that first response repeatable. It takes a consistent, read-only snapshot of what the server is doing, and presents it in the order an experienced engineer would look at it. It follows the workflow in SQL Server Performance Tuning: A Practical Checklist.
Architecture
Target
- SQL Server instanceRead-only access to DMVs and Query Store
Collectors
- Active requests
- Blocking
- Waits
- Query stats
- Query Store
Snapshot
- Timestamped snapshot filesRaw results kept as evidence
Analysis
- Python analysisGroup, rank and compare snapshots
Output
- Console summary
- HTML report
Collectors are plain T-SQL files, so they can be reviewed, run by hand, and reused without the tool. The Python layer handles connection, scheduling, grouping and reporting. Snapshots are written to disk before analysis, so the evidence survives even if the analysis step fails.
How it works
- 1Connect read-onlyVIEW SERVER STATE, or VIEW SERVER PERFORMANCE STATE on SQL Server 2022 and later
- 2Capture snapshotRequests, sessions, waits, blocking, query stats
- 3Blocking firstHead blockers and the full chain
- 4Active workWhat is running, for how long, waiting on what
- 5Expensive queriesBy total CPU, reads, writes, duration and executions
- 6Group the workloadBy database, login, host and application
- 7ReportSummary first, raw evidence attached
The planned capabilities are:
- Active sessions and requests: status, command, elapsed time, wait type and wait time, CPU, reads and writes.
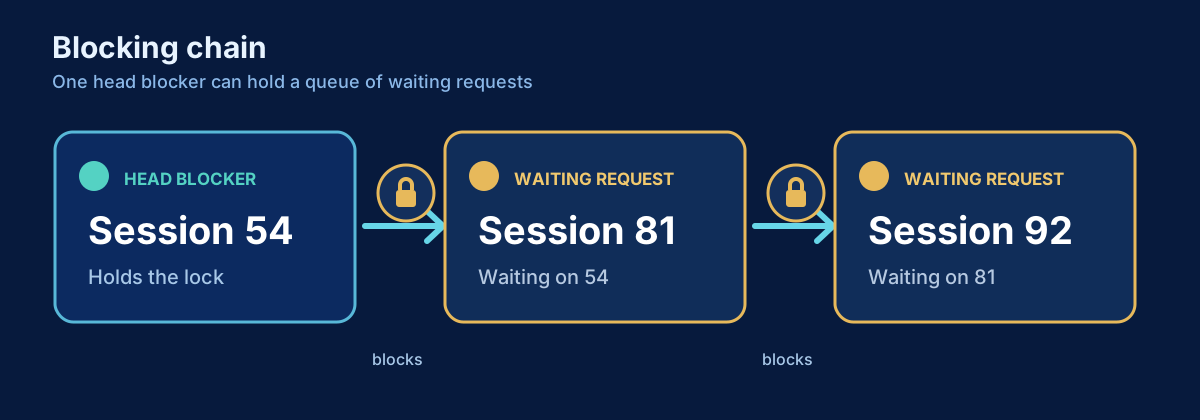
- Blocking: head blockers, chain depth and the statements involved.
- Waits: the top wait types for the capture interval, rather than since startup, so they describe the incident.
- Expensive queries: ranked by total impact, with query text and plan handle, using
sys.dm_exec_query_statsand Query Store where it is enabled. - Workload grouping: totals by login, database and host, which often shows that one application or job dominates.
Implementation walkthrough
Planned milestones:
- Collector scripts: the T-SQL queries, each documented with what it answers and its overhead.
- Python runner: connection handling, running collectors, writing snapshot files.
- Analysis: ranking, grouping and comparing two snapshots taken minutes apart.
- Report: a console summary and a self-contained HTML report.
- Plan information: capturing plan XML for the top queries and flagging common warnings.
Student path
For students
Prerequisites
- A local SQL Server (Developer Edition) or a test instance you are allowed to query
- Basic T-SQL; basic Python
Concepts to understand first
What a session, a request and a wait are. The planned article How SQL Server Executes a Query covers the background.
Guided steps
Run each collector query by hand first and read its output before using the tool. Then reproduce a blocking scenario with two query windows and watch the analyzer find the head blocker.
Exercises
- Write a query that returns the top five waits for the last minute, not since startup.
- Create a blocking chain three sessions deep and identify the head blocker from the DMVs alone.
- Compare the top queries by average duration and by total CPU, and explain why they differ.
Try this next
Enable Query Store on a test database, run a workload, and compare what Query Store shows with the DMV snapshot.
Expected outcomes
You will be able to answer “what is SQL Server doing right now, and why is it slow?” with evidence, and know which DMV answers which question.
Professional considerations
For professionals
Architecture decisions
T-SQL collectors keep the logic reviewable by DBAs and usable without Python. Snapshots to disk make the tool safe to use during incidents and provide evidence for later review.
Security
The tool needs only read permissions on server state, never sysadmin. Snapshots can contain query text and parameters, so they are treated as sensitive. The report has an option to omit query text.
Overhead and failure modes
Collectors are designed to be lightweight. Plan capture is opt-in because reading plan XML for many queries is not free. Every collector has a timeout, so the tool cannot become part of the problem it is investigating.
Repeatable incident workflow
The same snapshot format on every incident makes before-and-after comparisons and post-incident reviews straightforward. Two snapshots a few minutes apart are more useful than one.
Alternatives considered
- Commercial monitoring tools: better for continuous history; this tool targets the first response and learning.
- Community diagnostic scripts: excellent and widely used; the analyzer focuses on a smaller, guided workflow and a shareable report.
- Extended Events sessions: the right tool for deadlocks and long-term tracing; out of scope for the first version.
Common mistakes
- Reading cumulative waits since startup as if they described the current incident.
- Ranking queries only by average duration and missing frequent, cheap-looking queries.
- Killing the blocking session before capturing what it was doing.
- Running diagnostic queries with more permissions than they need.
Next improvements
- Publish the collector scripts with documentation.
- Add a comparison mode for “before and after a change”.
- Explore exporting snapshots to a table for trend analysis.
Repository, demo and downloads
Nothing has been published yet. The repository, demo and downloads will be linked here when they exist.
Related articles

SQL Server
SQL Server Performance Tuning: A Practical Checklist
A production-oriented checklist for investigating SQL Server performance with evidence instead of guesses.

DevOps & Observability
Monitoring SQL Server Workloads in Real Time
Inspect active SQL Server requests, sessions and connections, then connect current state to retained Query Store history.
SQL Server
How to Find Blocking in SQL Server
Find blocked requests, trace blocking chains to the head blocker, and inspect the responsible session and transaction safely.
SQL Server
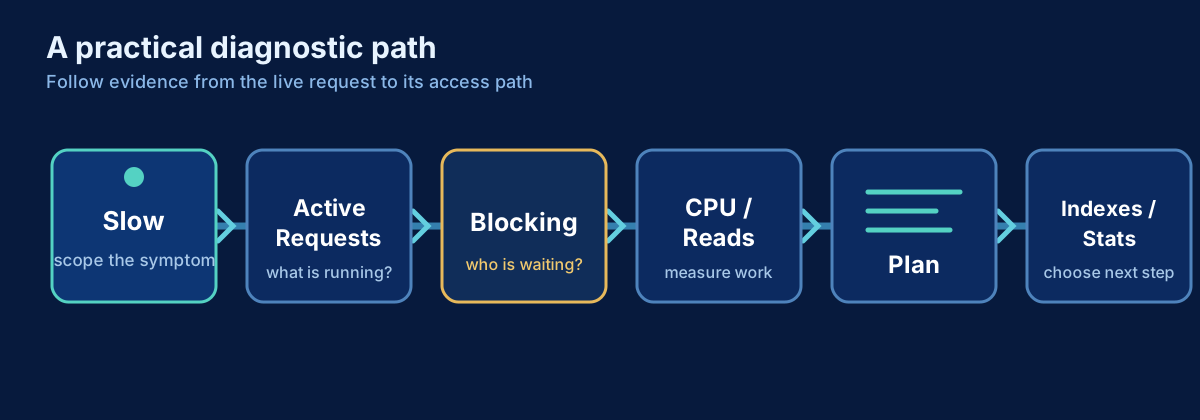
SQL Server Is Slow: A Practical Troubleshooting Workflow
A production-first workflow for turning a vague SQL Server slowdown into evidence, a likely cause, and a safe next step.
SQL Server
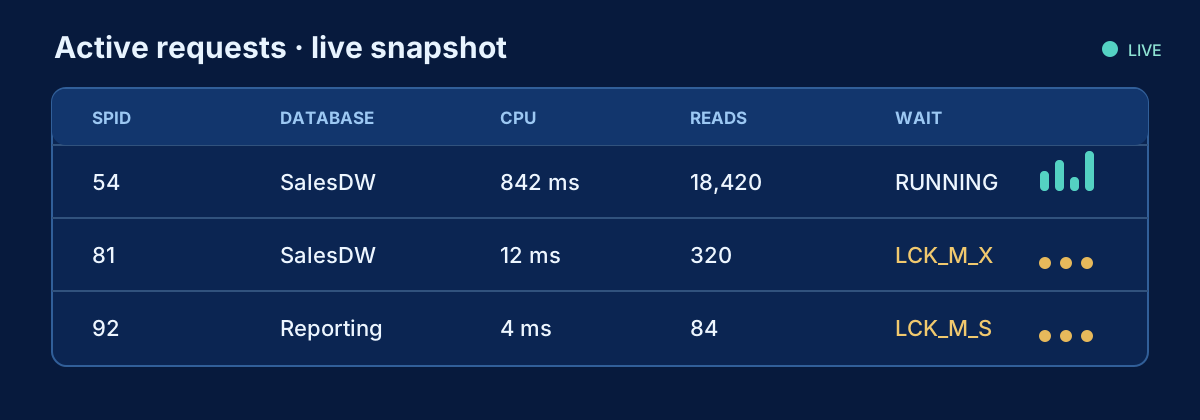
How to Find What Is Running in SQL Server Right Now
A production-safe DMV query for active SQL Server requests, including statement text, identity, resource use, waits and blocking.
SQL Server
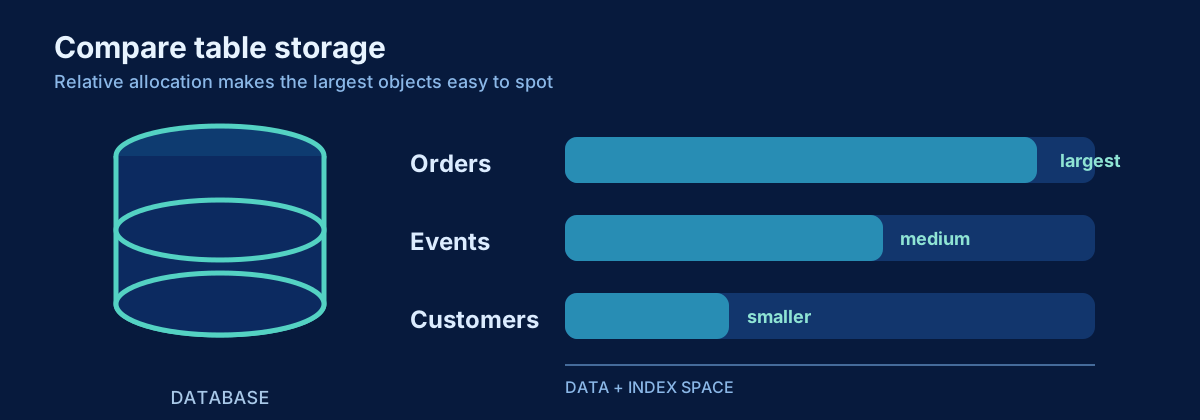
How to See SQL Server Table Sizes
Measure SQL Server row counts, reserved space, data, indexes and unused allocation without double-counting partitions or allocation units.
Planned articles on these topics
- PlannedFinding the Queries That Are Really Hurting Your SQL Server
- PlannedHow to Troubleshoot Blocking and Long-Running Sessions in SQL Server
- PlannedReading SQL Server Execution Plans Without Guessing
- PlannedSQL Server Query Store for Production Performance Investigations
- PlannedParameter Sniffing in SQL Server: Diagnose It Before You Fix It
- PlannedBatching Large UPDATE and DELETE Operations in SQL Server
Have feedback or want to collaborate? Contact me