Operations

Monitoring & Observability

Monitoring, logging and debugging production systems.

Patterns for dashboards, alerts, execution logs, request observability and fast production diagnosis.

Start here

A practical path: instrument Fabric workloads, watch SQL Server in real time, turn signals into a tuning workflow, then log every run.

Monitoring foundations

What to measure across a data platform and its services, and how to read those signals.

Logging & diagnostics

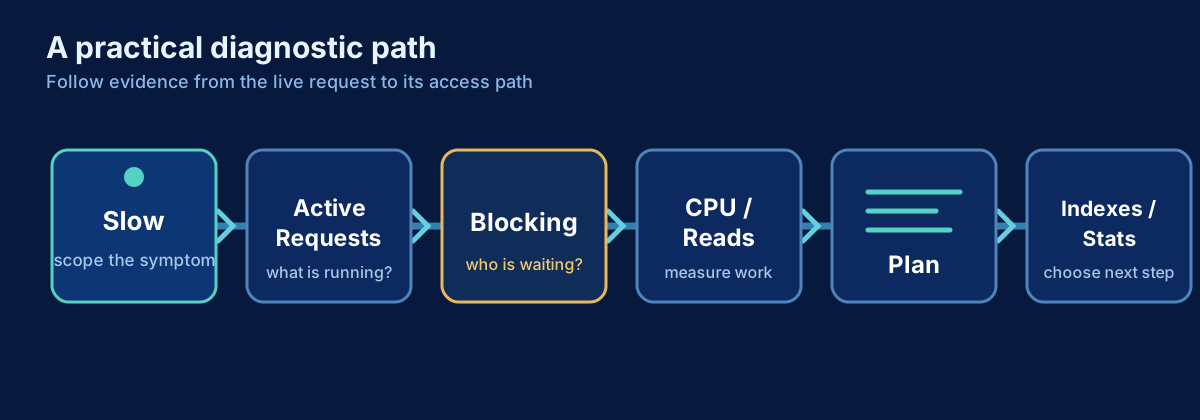
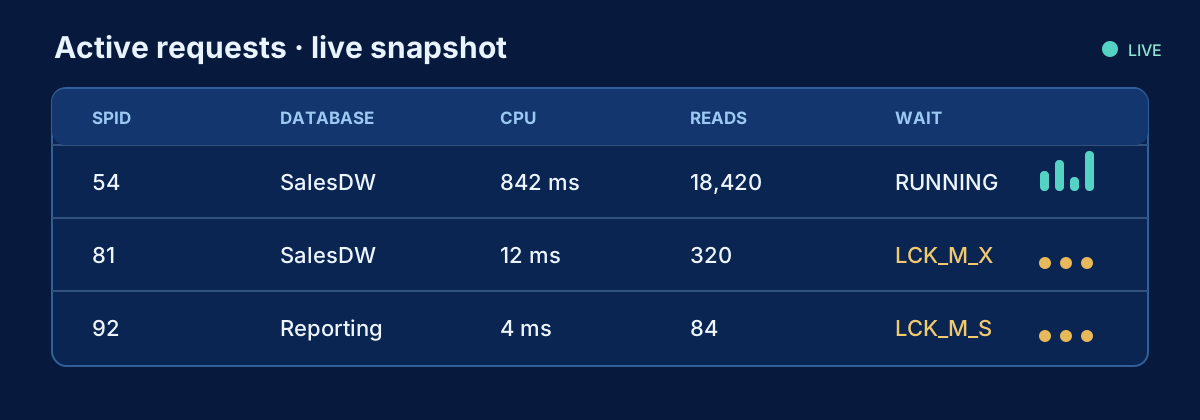
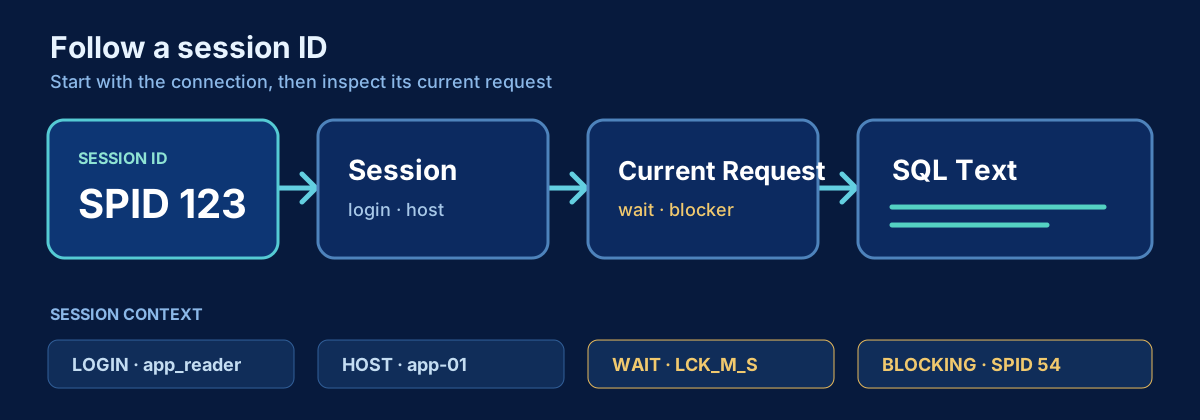
From a symptom to its cause: running queries, sessions, blocking and regressions.

View all monitoring & observability articles →

Cheat sheets

Browse all →
  • SQL ServerIndexingIntermediate

    Check Index Usage

    Review SQL Server index read and write activity, identify low-value indexes, and decide what deserves deeper analysis before any index is removed.

  • SQL ServerStorage & CapacityIntermediate

    Check SQL Server Table Sizes

    Measure SQL Server table row counts and storage usage, separate data from index space, and identify which tables are driving database growth.

  • SQL ServerTroubleshootingIntermediate

    Find Blocking in SQL Server

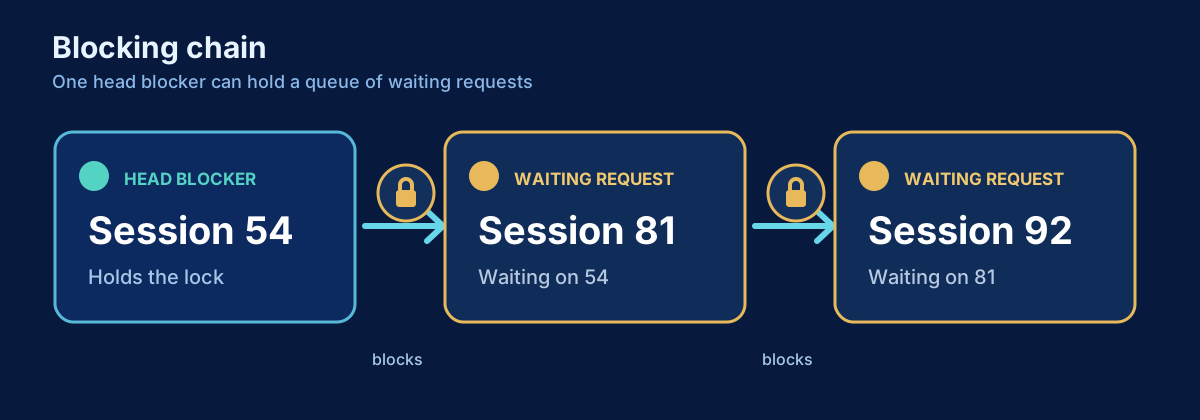
    Identify blocked sessions, blockers, lock waits, and the head blocker so you can troubleshoot SQL Server blocking without killing the wrong session.

  • SQL ServerPerformanceIntermediate

    Find High CPU Queries

    Identify SQL Server queries consuming the most CPU now and historically, distinguish total CPU from CPU per execution, and choose the right next tuning step.

  • SQL ServerPerformanceIntermediate

    Find High Read Queries

    Identify SQL Server queries performing the most logical and physical reads, separate read-heavy workload from CPU-heavy workload, and choose the right next tuning step.

  • SQL ServerPerformanceIntermediate

    Find Long-Running Queries

    Identify long-running SQL Server requests and historical slow queries, separate elapsed time from CPU time, and determine whether the delay comes from waits, blocking, reads, or plan regression.