Runbook SQL Server
SQL Server Blocking Runbook
A practical SQL Server blocking runbook for identifying the head blocker, inspecting open transactions, analyzing locks and resolving persistent blocking safely.
- Last reviewed
- Platform
- SQL Server
- Who operates this
- SQL Server DBAs · Database engineers · Production support engineers · Senior developers troubleshooting database contention
Open this runbook when
SQL Server sessions are blocked, application requests are waiting or timing out, and you need to find the head blocker and resolve it safely.
On this page
Work through this page top to bottom. It assumes SSMS and the permissions listed under Immediate checks. SQL Server behaviour comes from Microsoft Learn (references). The severity levels and the order of the steps are Javi Builds engineering judgement, so adapt them to your own incident process. The queries are read-only and were run against a reproduced blocking chain on SQL Server 2022 and 2025.
Trigger
Open this runbook when blocking is persistent, recurring or affecting users or jobs:
- Application requests are timing out, or users report slow transactions.
- Monitoring shows blocked sessions or wait chains that persist.
- One session is blocking many others.
- Blocking repeats at the same time each day.
- A long transaction appears to be holding locks.
Do not open it just because locks exist, one request briefly waits, or blocking clears immediately. That is the engine working as designed.
Use a different procedure when:
- There is no blocking and SQL Server is simply slow. Start with the SQL Server is slow workflow.
- Sessions fail with a deadlock error. A deadlock is a cycle that SQL Server resolves by choosing a victim. Blocking is a line of waiters that can persist.
- You are on Azure SQL Database. Follow Microsoft’s Azure SQL Database guidance, because available views and permissions differ.
Severity and impact
Classify the impact before you touch anything.
| Question | Why it matters |
|---|---|
| Is only one request blocked, or are many queued behind one blocker? | Shows how far the impact reaches |
| Are application timeouts occurring? | Confirms users are affected |
| Is a critical transaction affected? | Sets the priority |
| Is the blocker still running? | Decides whether it can finish by itself |
| Is the head blocker sleeping with an open transaction? | It may never finish by itself |
| Is rollback already in progress? | Rollback must complete |
| Is the issue limited to one database or application? | Narrows the owner and the scope |
| Level | What you see | Response |
|---|---|---|
| Low | Short-lived blocking, no user impact, no timeouts, clears naturally | Observe and record |
| Moderate | Repeated blocking, measurable latency, several blocked sessions | Investigate now |
| High | Many sessions blocked, user-facing timeouts, critical workload affected | Mitigate now |
| Critical | Widespread transaction failure, production processing halted, chain still growing | Mitigate and escalate |
These levels are a starting point, not an SLA.
Immediate checks
Do these in order. Save each result set with a timestamp as you go, because the evidence disappears when the blocking clears.
- Confirm the blocking chain with the query below.
- Find the head blocker. Follow the chain to the session that blocks others and is not itself blocked.
- Check whether a rollback is already running before anything else. See Rollback already running.
- Inspect the head blocker: what it is, who owns it, and how long its transaction has been open.
- Decide whether it is active or sleeping. Then follow the decision tree.
- Look at locks and waits if the cause is still unclear.
Permissions. To see other sessions, SQL Server 2019 and earlier need VIEW SERVER STATE, and SQL Server 2022 and later need VIEW SERVER PERFORMANCE STATE. VIEW SERVER STATE covers it. Without these you only see your own session, which can look like no blocking at all.
Confirm the blocking chain
sys.dm_exec_requests.blocking_session_id is the primary source, but that view only lists sessions that are executing. A sleeping head blocker has no request, so this query starts from sys.dm_exec_sessions to keep it in the results. Prefer it to sp_who2, which is only a legacy quick check.
WITH blockers AS
(
    SELECT blocking_session_id AS session_id,
           COUNT(*) AS directly_blocking
    FROM sys.dm_exec_requests
    WHERE blocking_session_id > 0
      AND blocking_session_id <> session_id
    GROUP BY blocking_session_id
)
SELECT
    s.session_id,
    NULLIF(r.blocking_session_id, 0) AS blocking_session_id,
    CASE WHEN b.session_id IS NOT NULL AND COALESCE(r.blocking_session_id, 0) = 0
         THEN 1 ELSE 0 END AS is_head_blocker,
    COALESCE(b.directly_blocking, 0) AS directly_blocking,
    DB_NAME(COALESCE(r.database_id, s.database_id)) AS database_name,
    COALESCE(r.status, s.status) AS status,
    r.wait_type,
    r.wait_time,
    r.wait_resource,
    s.open_transaction_count,
    s.login_name,
    s.host_name,
    s.program_name,
    SUBSTRING(t.text, (r.statement_start_offset / 2) + 1,
        ((CASE r.statement_end_offset
              WHEN -1 THEN DATALENGTH(t.text)
              ELSE r.statement_end_offset
          END - r.statement_start_offset) / 2) + 1) AS statement_text,
    t.text AS batch_text,
    ib.event_info AS input_buffer,
    r.start_time AS request_start_time,
    s.last_request_start_time,
    s.last_request_end_time
FROM sys.dm_exec_sessions AS s
LEFT JOIN sys.dm_exec_requests AS r
    ON r.session_id = s.session_id
LEFT JOIN sys.dm_exec_connections AS c
    ON c.session_id = s.session_id
   AND c.parent_connection_id IS NULL
LEFT JOIN blockers AS b
    ON b.session_id = s.session_id
OUTER APPLY sys.dm_exec_sql_text(COALESCE(r.sql_handle, c.most_recent_sql_handle)) AS t
OUTER APPLY sys.dm_exec_input_buffer(s.session_id, r.request_id) AS ib
WHERE b.session_id IS NOT NULL
   OR (r.blocking_session_id <> s.session_id
       AND (r.blocking_session_id > 0 OR r.blocking_session_id IN (-2, -3)))
ORDER BY is_head_blocker DESC, directly_blocking DESC, r.wait_time DESC;Notes
- lines 35–37Starts from sessions, not requests: a sleeping head blocker holds locks in an open transaction but has no request, so sys.dm_exec_requests alone would miss it.
- line 43For a sleeping session, the connection's most_recent_sql_handle gives the last statement it sent.
- lines 46–47Negative blocker IDs: -2 is an orphaned distributed transaction, -3 a deferred recovery transaction.
How to read it:
wait_timeis in milliseconds. Run the query twice. Rising values on the same sessions mean the blocking persists.statement_textis empty for a sleeping session because nothing is executing.batch_textandinput_bufferthen show the most recent batch, which is not always the statement that took the locks.blocking_session_idof-2is an orphaned distributed transaction and-3is a deferred recovery transaction. Neither has a session to inspect, so go to Escalation.- No rows means nothing is blocked at this moment. If blocking keeps recurring, use Extended Events.
DMV results are a live snapshot, so one sample can be inconsistent. Take a second one before you act.
Find the head blocker
A session can be blocked by another session that is itself blocked. Do not assume the first blocking_session_id you see is the root cause. Follow the chain until you reach the session that blocks others and is not blocked. That row has is_head_blocker = 1.
- Session 87Blocked session
- blocked bySession 86Blocker
- blocked bySession 72Blocker
- blocked bySession 64Head blocker
If several rows show is_head_blocker = 1, you have several chains. Start with the highest directly_blocking that affects a critical workload.
Inspect the head blocker
Set the session ID and run this for the head blocker. It works for active and sleeping sessions. It returns one row per database in the transaction.
DECLARE @head_blocker int = 0;  -- set this to the head blocker's session_id

SELECT
    s.session_id,
    s.login_time,
    s.status AS session_status,
    r.status AS request_status,
    r.command,
    r.wait_type,
    r.percent_complete,
    s.open_transaction_count,
    s.transaction_isolation_level,
    s.login_name,
    s.host_name,
    s.program_name,
    s.cpu_time,
    s.logical_reads,
    s.last_request_start_time,
    s.last_request_end_time,
    DB_NAME(dt.database_id) AS transaction_database,
    at.transaction_begin_time,
    DATEDIFF(SECOND, at.transaction_begin_time, SYSDATETIME()) AS transaction_age_seconds,
    at.transaction_type,
    at.transaction_state,
    st.is_local,
    st.is_enlisted,
    dt.database_transaction_log_bytes_used,
    ib.event_info AS input_buffer
FROM sys.dm_exec_sessions AS s
LEFT JOIN sys.dm_exec_requests AS r
    ON r.session_id = s.session_id
LEFT JOIN sys.dm_tran_session_transactions AS st
    ON st.session_id = s.session_id
LEFT JOIN sys.dm_tran_active_transactions AS at
    ON at.transaction_id = st.transaction_id
LEFT JOIN sys.dm_tran_database_transactions AS dt
    ON dt.transaction_id = st.transaction_id
OUTER APPLY sys.dm_exec_input_buffer(s.session_id, r.request_id) AS ib
WHERE s.session_id = @head_blocker;Pay attention to:
transaction_age_secondsandlast_request_end_time. A transaction that is old on a session that went idle long ago is a strong signal.database_transaction_log_bytes_used. A rough sense of how much work a rollback would have to undo.transaction_type = 4oris_enlisted = 1. A distributed transaction, which is an escalation case.transaction_isolation_level.3is repeatable read and4is serializable. Both hold locks longer than the default2, read committed.host_name. It is supplied by the client, so treat it as a hint.
Locks and waiting tasks
Use these when the cause is still unclear. sys.dm_tran_locks can return a very large number of rows on a busy instance, so always filter or aggregate it. This query limits it to locks that tasks are waiting on right now.
SELECT
    wt.session_id,
    wt.blocking_session_id,
    wt.wait_type,
    wt.wait_duration_ms,
    tl.resource_type,
    tl.request_mode,
    tl.request_status,
    DB_NAME(tl.resource_database_id) AS database_name,
    tl.resource_associated_entity_id,
    wt.resource_description
FROM sys.dm_os_waiting_tasks AS wt
INNER JOIN sys.dm_tran_locks AS tl
    ON tl.lock_owner_address = wt.resource_address
WHERE wt.blocking_session_id IS NOT NULL
ORDER BY wt.wait_duration_ms DESC;This one summarizes what the head blocker holds, instead of listing every lock.
DECLARE @head_blocker int = 0;  -- set this to the head blocker's session_id

SELECT
    DB_NAME(resource_database_id) AS database_name,
    resource_type,
    request_mode,
    request_status,
    COUNT(*) AS lock_count
FROM sys.dm_tran_locks
WHERE request_session_id = @head_blocker
GROUP BY resource_database_id, resource_type, request_mode, request_status
ORDER BY lock_count DESC;How to read them:
wait_type.LCK_M_*is a lock wait, and the suffix is the requested mode:LCK_M_Xwants exclusive,LCK_M_Swants shared. See wait types.resource_type. What is locked:KEY,RID,PAGE,OBJECTand so on. With optimized locking enabled you can also seeXACT.request_modeandrequest_status. The mode, and whether it isGRANT,WAITorCONVERT.resource_associated_entity_id. ForKEY,PAGEandRIDthis is ahobt_id. To name the table, run this in the affected database:SELECT OBJECT_NAME(object_id) FROM sys.partitions WHERE hobt_id = <value>;
Evidence to collect
Copy this and fill it in as you go. Capture it before any mitigation, because a terminated session takes its evidence with it.
Incident start:
Database:
Head blocker session_id:
Head blocker login_time:
Blocked session count:
Head blocker status:
Blocking statement:
Application / program:
Login:
Host:
Open transaction count:
Transaction start:
Transaction log bytes used:
Wait type:
Wait resource:
Lock mode:
Timeouts observed:
Recent deployment/change:
Scheduled batch running:
Action taken:
Rollback required:
Recovery time:
Do not include passwords, connection strings or other sensitive values. SQL text and input buffers can contain literal customer data, and logins can identify people, so redact them before you share this outside the team.
Decision tree
Start only if the blocking is persistent or affecting users. Otherwise observe and stop.
- SymptomBlocking observed
- DecidePersistent or impacting users?No: observe and record. Yes: continue.
- InvestigateFind the head blocker
- rolling backObserveRollback in progressStatus rollback, or STATUSONLY shows progress. Monitor it. Do not kill it again.
- idleCorrect applicationSleeping with open transactionStatus sleeping, open transactions above 0. Application issue. Find the owner.
- executingInvestigateActive queryStatus running, runnable or suspended. Inspect the query, plan and transaction scope.
- unclearInvestigateCause still unclearNone of the above. Go deeper on locks and waits, or capture with Extended Events.
- DecideCan the blocker safely complete?Yes: monitor. No: evaluate cancellation or KILL with approval.
- Validate recovery
- Capture root cause
- Permanent fix
Rollback already running
Rollback must complete. It cannot be safely skipped, and it keeps holding its locks until it finishes.
This command only reports progress. It does not end or roll back anything:
KILL <spid> WITH STATUSONLY;| Result | Meaning |
|---|---|
transaction rollback in progress with a percentage |
Rollback is running. Keep monitoring |
Msg 6120, Rollback operation ... is not in progress |
No rollback reported. Microsoft documents this command for rollbacks started by KILL, so check status too |
Process ID ... is not an active process ID |
The session has gone. Confirm with the chain query |
Treat the estimate as a trend, not a promise. Estimates can be unreliable, especially early: in one local test it reported 900 seconds remaining at 0% for a rollback that finished in a few seconds. Microsoft notes that a statement that ran for an hour could take at least an hour to roll back. Lengthy rollbacks are rare when Accelerated Database Recovery is enabled.
Do not restart the instance to escape a rollback. The database then has to finish the same work during recovery, and it is inaccessible until it does.
Sleeping session with an open transaction
A sleeping session with open_transaction_count above 0 can hold locks even though no request is running. It will not resolve by itself, because SQL Server is waiting for the application to commit or roll back. Confirm it with the head blocker query and the open transactions cheat sheet.
Common causes:
- Timeout or cancel without rollback. A query timeout ends the batch, not the transaction. The application must roll back.
- The application forgot to commit or roll back on one code path, often an error path.
- A long user transaction, such as one left open across user input or an ad hoc SSMS window.
- Connection pooling with bad transaction handling. The connection returns to the pool with its transaction still open.
Do not automatically kill it. Identify the owner from program_name, host_name and login_name. The cleanest resolution is the owner committing or rolling back, so that uncommitted work is not lost unintentionally. Killing it rolls that work back, so it is a decision, not a reflex.
Long-running active query
If the head blocker is running, runnable or suspended, it is still working. Check whether:
- The query is legitimately long, such as a known batch or maintenance job.
- The execution plan is poor. Compare it with Query Store.
- A large update or delete is running, or a scan is touching far more rows than needed.
- Lock escalation occurred. See the pattern table below.
- The transaction scope is too large, with many statements under one transaction.
The usual responses, in order, are to let it finish and tune it later, reduce competing work, or stop it only if the impact justifies the rollback. KILL is never the first action here, because the rollback can outlast the query.
Common blocking patterns
| Pattern and signals | Likely cause and action |
|---|---|
| Active long-running blocker. Running, runnable or suspended, with CPU or reads increasing | Query still executing. Inspect it, tune it, decide whether to let it finish |
| Sleeping blocker, open transaction. Sleeping, open transactions above 0, old last request | Uncommitted transaction. Find the application or owner, and commit or roll back safely |
Application not consuming rows. Runnable, or ASYNC_NETWORK_IO waits, with little progress |
Locks held while the client has not finished fetching. Investigate the application |
Rollback. Status rollback, or WITH STATUSONLY reports progress |
Monitor it. Do not interfere unnecessarily |
Lock escalation. Head blocker holds an OBJECT lock in S or X mode, not an intent mode |
Large transaction or lock footprint. Reduce transaction size and review the query design |
| Repeated scheduled blocking. Same time each day, same job or report | Batch or report overlaps OLTP work. Reschedule or redesign it |
Distributed transaction. Blocked by -2, or is_enlisted = 1 |
Orphaned or in-doubt transaction. Escalate |
Lock escalation does not cause most blocking problems. Confirm it with the lock_escalation event in the session below before you act on it. Avoid disabling escalation as a quick fix: Microsoft recommends against it, and lock memory can run out.
Capture intermittent blocking
If blocking disappears before you can inspect it, capture it with Extended Events. SQL Trace and SQL Server Profiler are deprecated, so do not start there. For a quick live look, SSMS has the XEvent Profiler node in Object Explorer.
Step 1: decide on a blocked process threshold. By default no blocked process reports are produced. The setting is the minimum number of seconds a task must be blocked before a report is generated, from 0 to 86,400, where 0 disables it.
This is a server-wide configuration change. It takes effect immediately without a restart, it is written to the error log, and it needs the ALTER SETTINGS permission, so put it through your change process. Reporting is best effort and can run several seconds late. Low values can substantially increase the number of reports when many tasks are blocked.
Record the current values first, so you can restore them:
SELECT name, value_in_use
FROM sys.configurations
WHERE name IN (N'show advanced options', N'blocked process threshold (s)');Then set a threshold above normal short blocking for this workload. This example uses 20 seconds:
EXECUTE sp_configure 'show advanced options', 1;
RECONFIGURE;
EXECUTE sp_configure 'blocked process threshold', 20;
RECONFIGURE;Step 2: create the session. Replace the database name and the file path. Completed-batch and RPC events can be high volume on a busy server, so keep the database filter and run the session only for as long as you need it. It requires ALTER ANY EVENT SESSION, or the granular event session permissions on SQL Server 2022 and later.
CREATE EVENT SESSION blocking_capture ON SERVER
ADD EVENT sqlserver.blocked_process_report,
ADD EVENT sqlserver.xml_deadlock_report,
ADD EVENT sqlserver.lock_escalation
    (ACTION (sqlserver.database_name, sqlserver.sql_text)),
ADD EVENT sqlserver.attention
    (ACTION (sqlserver.client_app_name, sqlserver.client_hostname,
             sqlserver.session_id, sqlserver.sql_text)
     WHERE sqlserver.database_name = N'YourDatabase'),
ADD EVENT sqlserver.rpc_completed
    (ACTION (sqlserver.client_app_name, sqlserver.session_id)
     WHERE sqlserver.database_name = N'YourDatabase'),
ADD EVENT sqlserver.sql_batch_completed
    (ACTION (sqlserver.client_app_name, sqlserver.session_id)
     WHERE sqlserver.database_name = N'YourDatabase')
ADD TARGET package0.event_file
    (SET filename = N'C:\xe\blocking_capture.xel',
         max_file_size = 256,
         max_rollover_files = 4)
WITH (MAX_MEMORY = 4 MB,
      EVENT_RETENTION_MODE = ALLOW_SINGLE_EVENT_LOSS,
      STARTUP_STATE = OFF);

ALTER EVENT SESSION blocking_capture ON SERVER STATE = START;Notes
- lines 9, 12, 15Replace YourDatabase: these filters keep the high-volume events to one database.
- line 17A folder on the SQL Server machine that the service account can write to.
- line 22STARTUP_STATE = OFF: the session does not restart with the instance.
blocked_process_report shows both sides of the blocking. attention shows client timeouts and cancels, which is the usual evidence for the sleeping branch. Batch and RPC completion events show what ran earlier in the transaction, which the input buffer cannot.
Step 3: clean up. Stop and drop the session, then restore the recorded values. Set show advanced options back too, because it applies to all users.
ALTER EVENT SESSION blocking_capture ON SERVER STATE = STOP;
DROP EVENT SESSION blocking_capture ON SERVER;

EXECUTE sp_configure 'blocked process threshold', 0;  -- your recorded value
RECONFIGURE;
EXECUTE sp_configure 'show advanced options', 0;      -- your recorded value
RECONFIGURE;Actions
Take the lowest-risk action that fits the evidence. Change one thing at a time and record it.
Observe
- Short blocking and expected transaction behaviour with no impact. Record it and take no action.
Investigate
- Identify the head blocker and inspect its transaction.
- Inspect the wait type and resource.
- Find the owner of the session before you decide anything.
Mitigate
- Stop noncritical competing work.
- Reschedule jobs that overlap the affected workload.
- Reduce concurrency on the affected path.
Correct application behavior
- Ensure every path commits or rolls back, including error paths. Microsoft suggests
IF @@TRANCOUNT > 0 ROLLBACK TRANin the client error handler. - Handle timeouts and cancels correctly.
SET XACT_ABORT ONhelps, but test it, because it changes how code behaves after an error. - Fetch result sets completely.
- Shorten transactions, and never hold one open while waiting for user input.
Optimize
- Tune the long-running query and its indexes to reduce its lock footprint.
- Run large DML in smaller batches, so each transaction takes fewer locks.
- Move large writes and index maintenance out of busy hours.
- Evaluate row versioning such as
READ_COMMITTED_SNAPSHOTin testing. It reduces reader and writer blocking, but it is a design change, not an incident fix.
Terminate session
Treat this as the last resort, not the fix. Use it only when all of these are true:
- The impact is significant and the blocker cannot safely complete.
- The blocker is understood: what it is doing and why it persists.
- The business or application owner has been considered, and approval is recorded.
- The rollback impact is understood, from
transaction_age_secondsanddatabase_transaction_log_bytes_used. - Evidence has been captured, including the statement and transaction details.
- It is the head blocker, not a blocked session.
- It is a user session:
is_user_process = 1insys.dm_exec_sessions. - The session ID still belongs to it:
login_timeandhost_namematch your evidence.
Validation
Do not declare success because one session ID disappeared. Recovery means all of these are true:
- Blocking chain cleared: the chain query returns no rows, or only short-lived ones.
- No new sessions accumulating behind the same blocker or the same resource.
- Application latency is back to normal.
- Timeouts have stopped.
- The open transaction is resolved:
open_transaction_countis 0 for that session, or the session is gone. - Rollback completed, if there was one:
WITH STATUSONLYno longer reports progress. - Scheduled workloads are behaving normally.
Run the chain query several times over a few minutes, then again through the next busy period or scheduled window.
The action did not work if the same chain reforms, a new head blocker appears on the same resource, or timeouts continue. Go back to the decision tree with the new evidence and consider escalating.
Rollback and safety
Know the way back before you change anything.
- Preserve evidence first. Save the chain, head blocker and transaction output before any mitigation.
- Reverse schedule and configuration changes once the incident is over: restore job schedules,
blocked process thresholdandshow advanced options, and drop the event session. - Document any killed session: session ID, login time, statement, approver, time, and how long the rollback took.
- Do not kill repeatedly without diagnosis. If blocking returns, the cause is still there.
- Do not make several performance changes at once. You will not know which one helped, or which one hurt.
- Do not restart the instance to clear blocking or a rollback.
- Do not reach for
NOLOCKor disable lock escalation to stop an incident. Both trade correctness or stability for a quiet chart.
Escalation
Escalate through your own incident process when any of these is true:
- The blocker belongs to a critical application and the transaction impact is unknown.
- Rollback is extremely long, or not progressing.
- Blocking returns immediately after mitigation.
- A distributed transaction is involved. Resolving one uses
KILLwith a unit of work ID, which needs someone who understands that transaction. - Application transaction management appears broken.
- Blocking affects multiple databases or services.
- An engine or platform defect is suspected. Contact Microsoft support through your support plan if you have one, and attach the evidence checklist.
After-action review
Do this while the evidence is still fresh.
- Root blocker: which session, application and statement?
- Blocking chain: how long and how wide did it get?
- Transaction duration: how long was it open?
- Affected workload: who and what was impacted, and for how long?
- Why did the transaction last so long?
- Did timeout or cancel behavior contribute?
- Why did monitoring catch it, or miss it?
- Permanent remediation: what is the fix, who owns it, and by when?
- Should a scheduled overlap change?
- Does query or application code need redesign?
- Should this runbook be updated?
Microsoft references
Checked on the last reviewed date above.
- Understand and resolve SQL Server blocking problems
- Resolve blocking problems caused by lock escalation
- KILL (Transact-SQL)
- sys.dm_exec_requests, sys.dm_exec_sessions and sys.dm_exec_input_buffer
- sys.dm_tran_active_transactions, sys.dm_tran_session_transactions and sys.dm_tran_database_transactions
- sys.dm_os_waiting_tasks and sys.dm_tran_locks
- blocked process threshold and sp_configure
- CREATE EVENT SESSION and XEvent Profiler
- SQL Server Profiler deprecation
- Transaction locking and row versioning guide
Quick references
Find Blocking in SQL Server
Identify blocked sessions, blockers, lock waits, and the head blocker so you can troubleshoot SQL Server blocking without killing the wrong session.
Find Open Transactions
Identify open transactions, find sessions holding them, measure transaction age, and connect long-running transactions to blocking, log growth, and application behavior.
SQL Server Wait Types
Use SQL Server wait statistics to identify where work is spending time, distinguish current waits from cumulative waits, and choose the next performance investigation.
Find Long-Running Queries
Identify long-running SQL Server requests and historical slow queries, separate elapsed time from CPU time, and determine whether the delay comes from waits, blocking, reads, or plan regression.
Understand the why
SQL ServerIntermediate
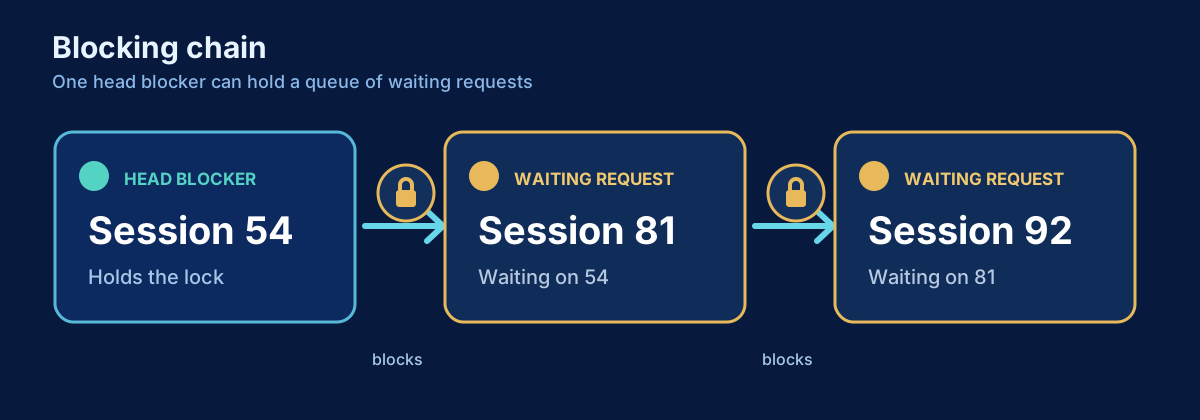
How to Find Blocking in SQL Server
Find blocked requests, trace blocking chains to the head blocker, and inspect the responsible session and transaction safely.
SQL ServerIntermediate
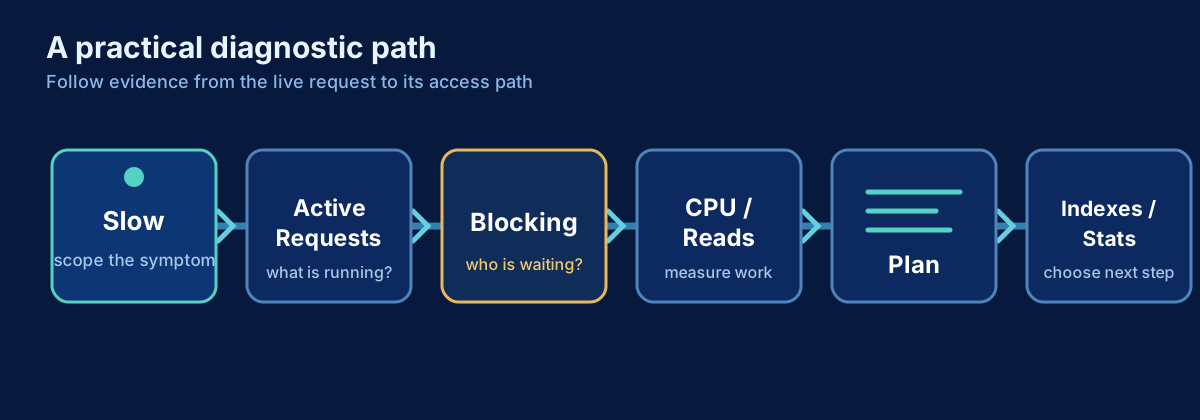
SQL Server Is Slow: The First 15 Minutes of Incident Triage
A production-first triage sequence for turning a vague SQL Server slowdown into evidence and a safe next diagnostic step in the first 10–15 minutes.
SQL ServerIntermediate
SQL Server Performance Tuning Workflow: From Slow Query to Root Cause
A practical SQL Server performance tuning workflow for moving from a vague slowdown to evidence, root cause, remediation, and validation using waits, Query Store, execution plans, blocking, I/O, CPU, memory, and workload context.
SQL ServerBeginner
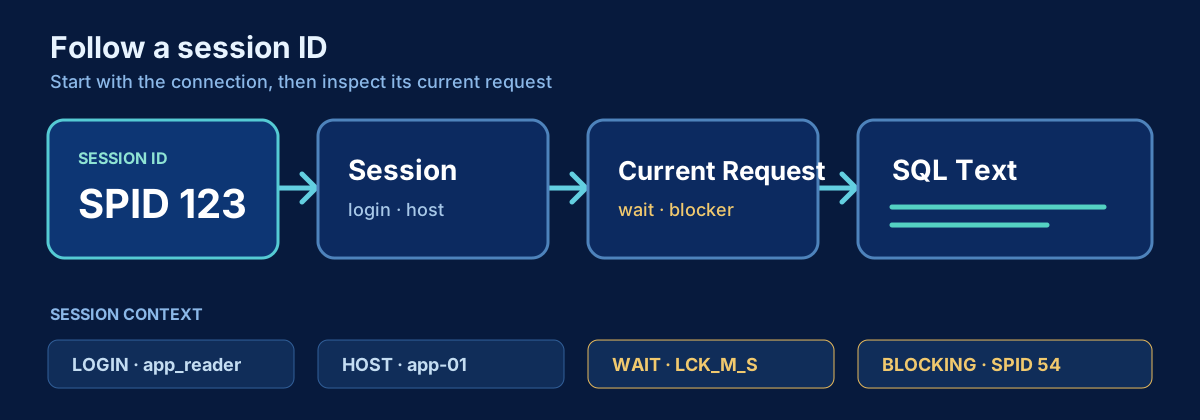
How to Get a SQL Server Session ID and See What It Is Doing
Find your SQL Server session ID, investigate another session, and inspect its request, SQL text, waits, blocking and open transaction state.
SQL ServerIntermediate
How to Find SQL Server Performance Regressions with Query Store
A practical Query Store workflow for SQL Server regressions: compare time windows, find queries that slowed down, inspect plan changes, force plans safely and undo them.
DevOps & ObservabilityIntermediate
Monitoring SQL Server Workloads in Real Time
Inspect active SQL Server requests, sessions and connections, then connect current state to retained Query Store history.